Keep going.
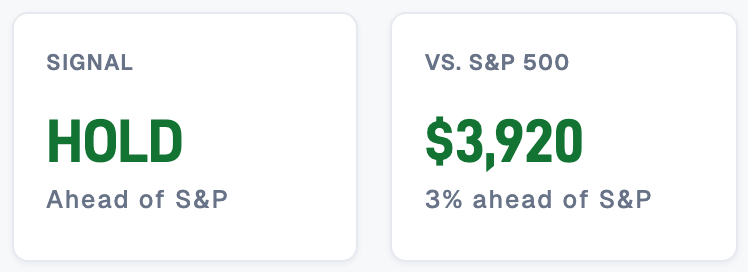
Your rental is ahead of the S&P 500, or it's worth waiting for. See how many years until it's worth the most.
Duplex Ray turns years of rent, repairs, and mortgage payments into your real return. Then it tells you whether to hold or sell, and when.
A sample duplex, fully loaded. No sign-up.
Open any brokerage app and you'll see your return: this year, all time, down to the decimal.
Open the folder for your rental and you'll see receipts, lease PDFs, a mortgage statement, and a spreadsheet you stopped updating two summers ago.
You know the rent covers the mortgage. You might live somewhere that's appreciating. It's probably working out. But "probably" isn't a return, and you can't compare "probably" to an index fund.
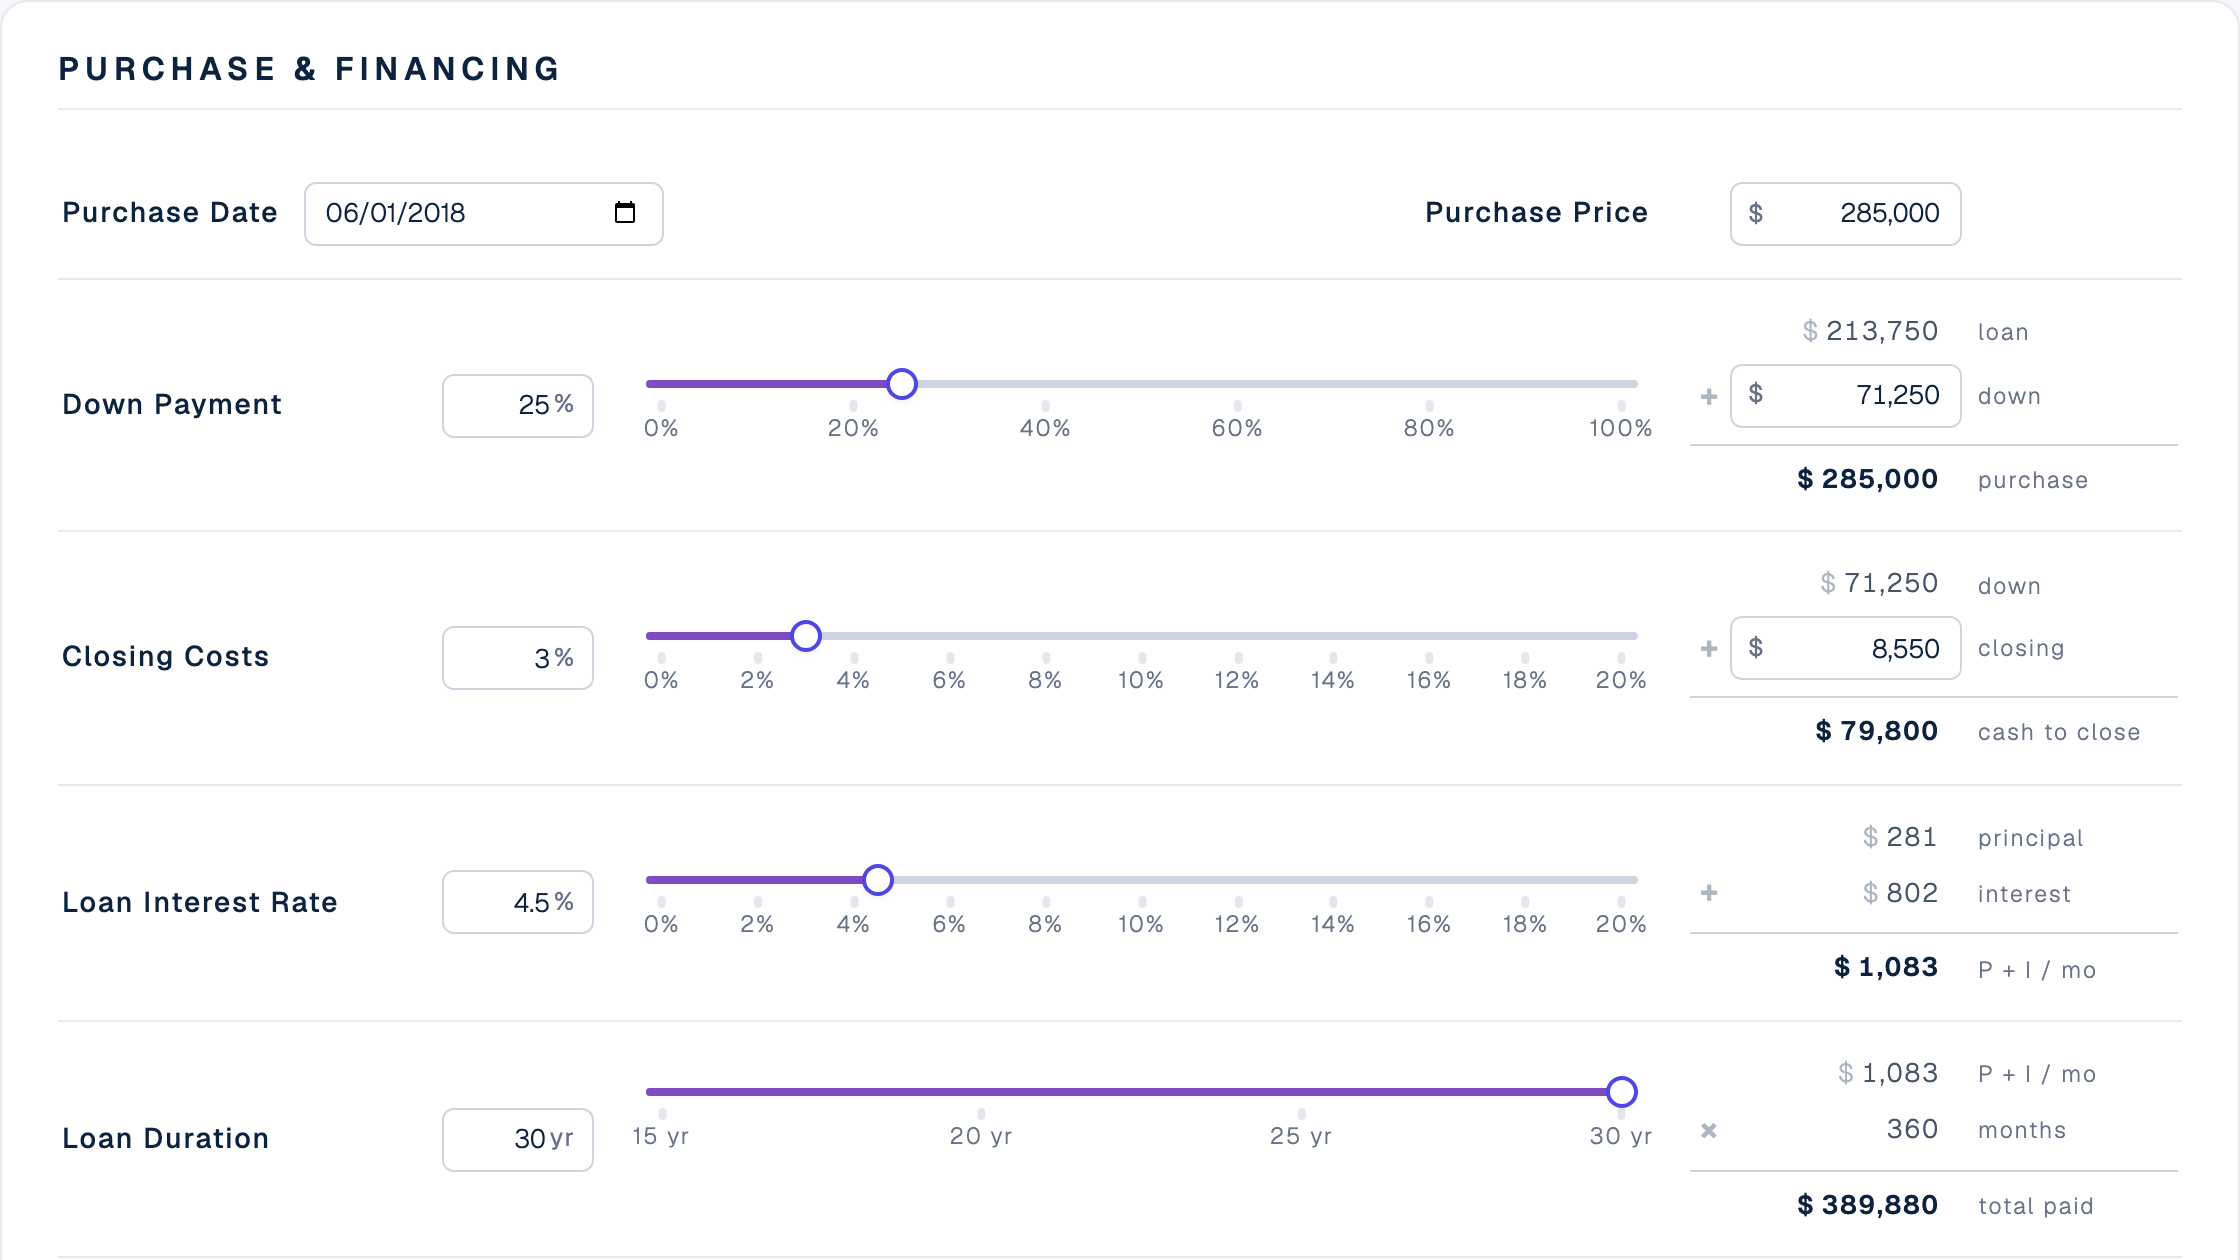
Step 1
Price, loan, and rents. The numbers you already know by heart.
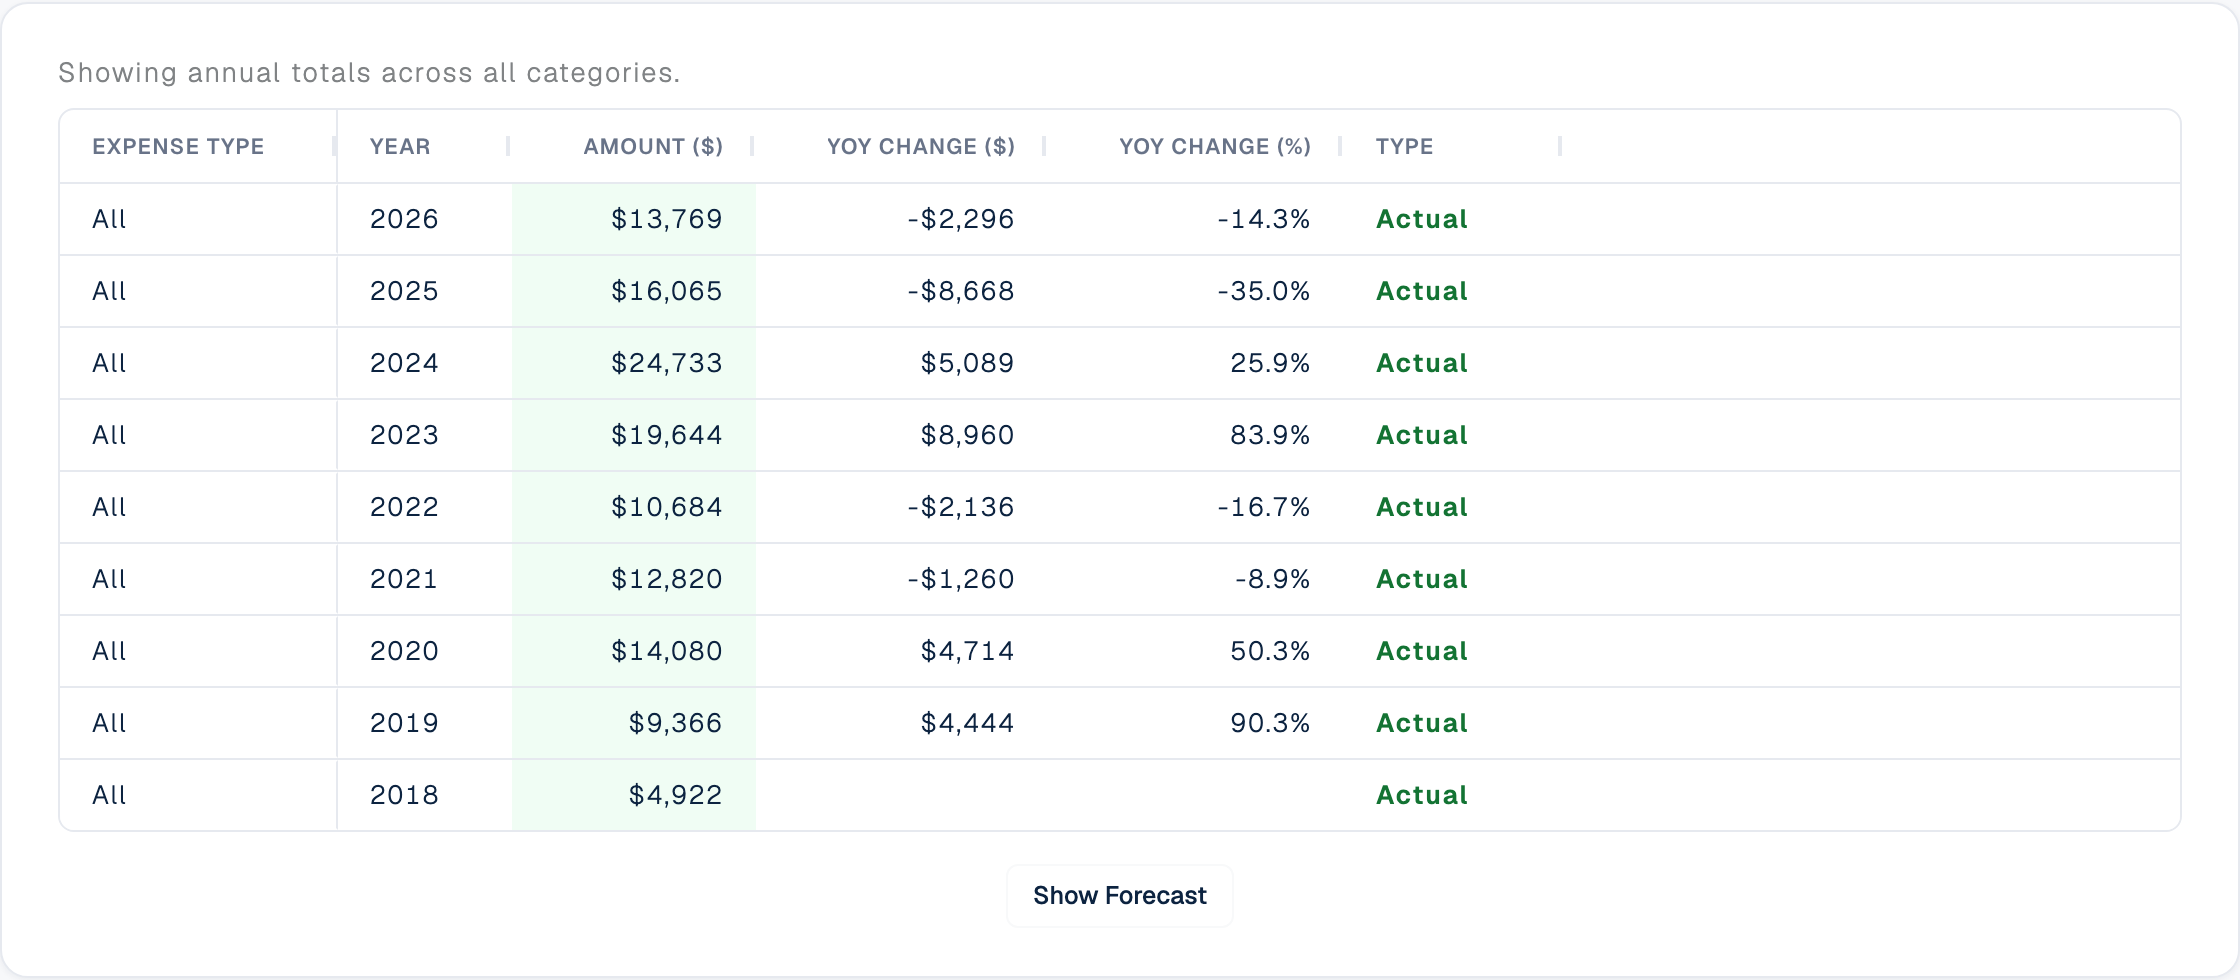
Step 2
Taxes, insurance, utilities, repairs, and every lease. Go as rough as a yearly total or as precise as every bill. Duplex Ray works with either.
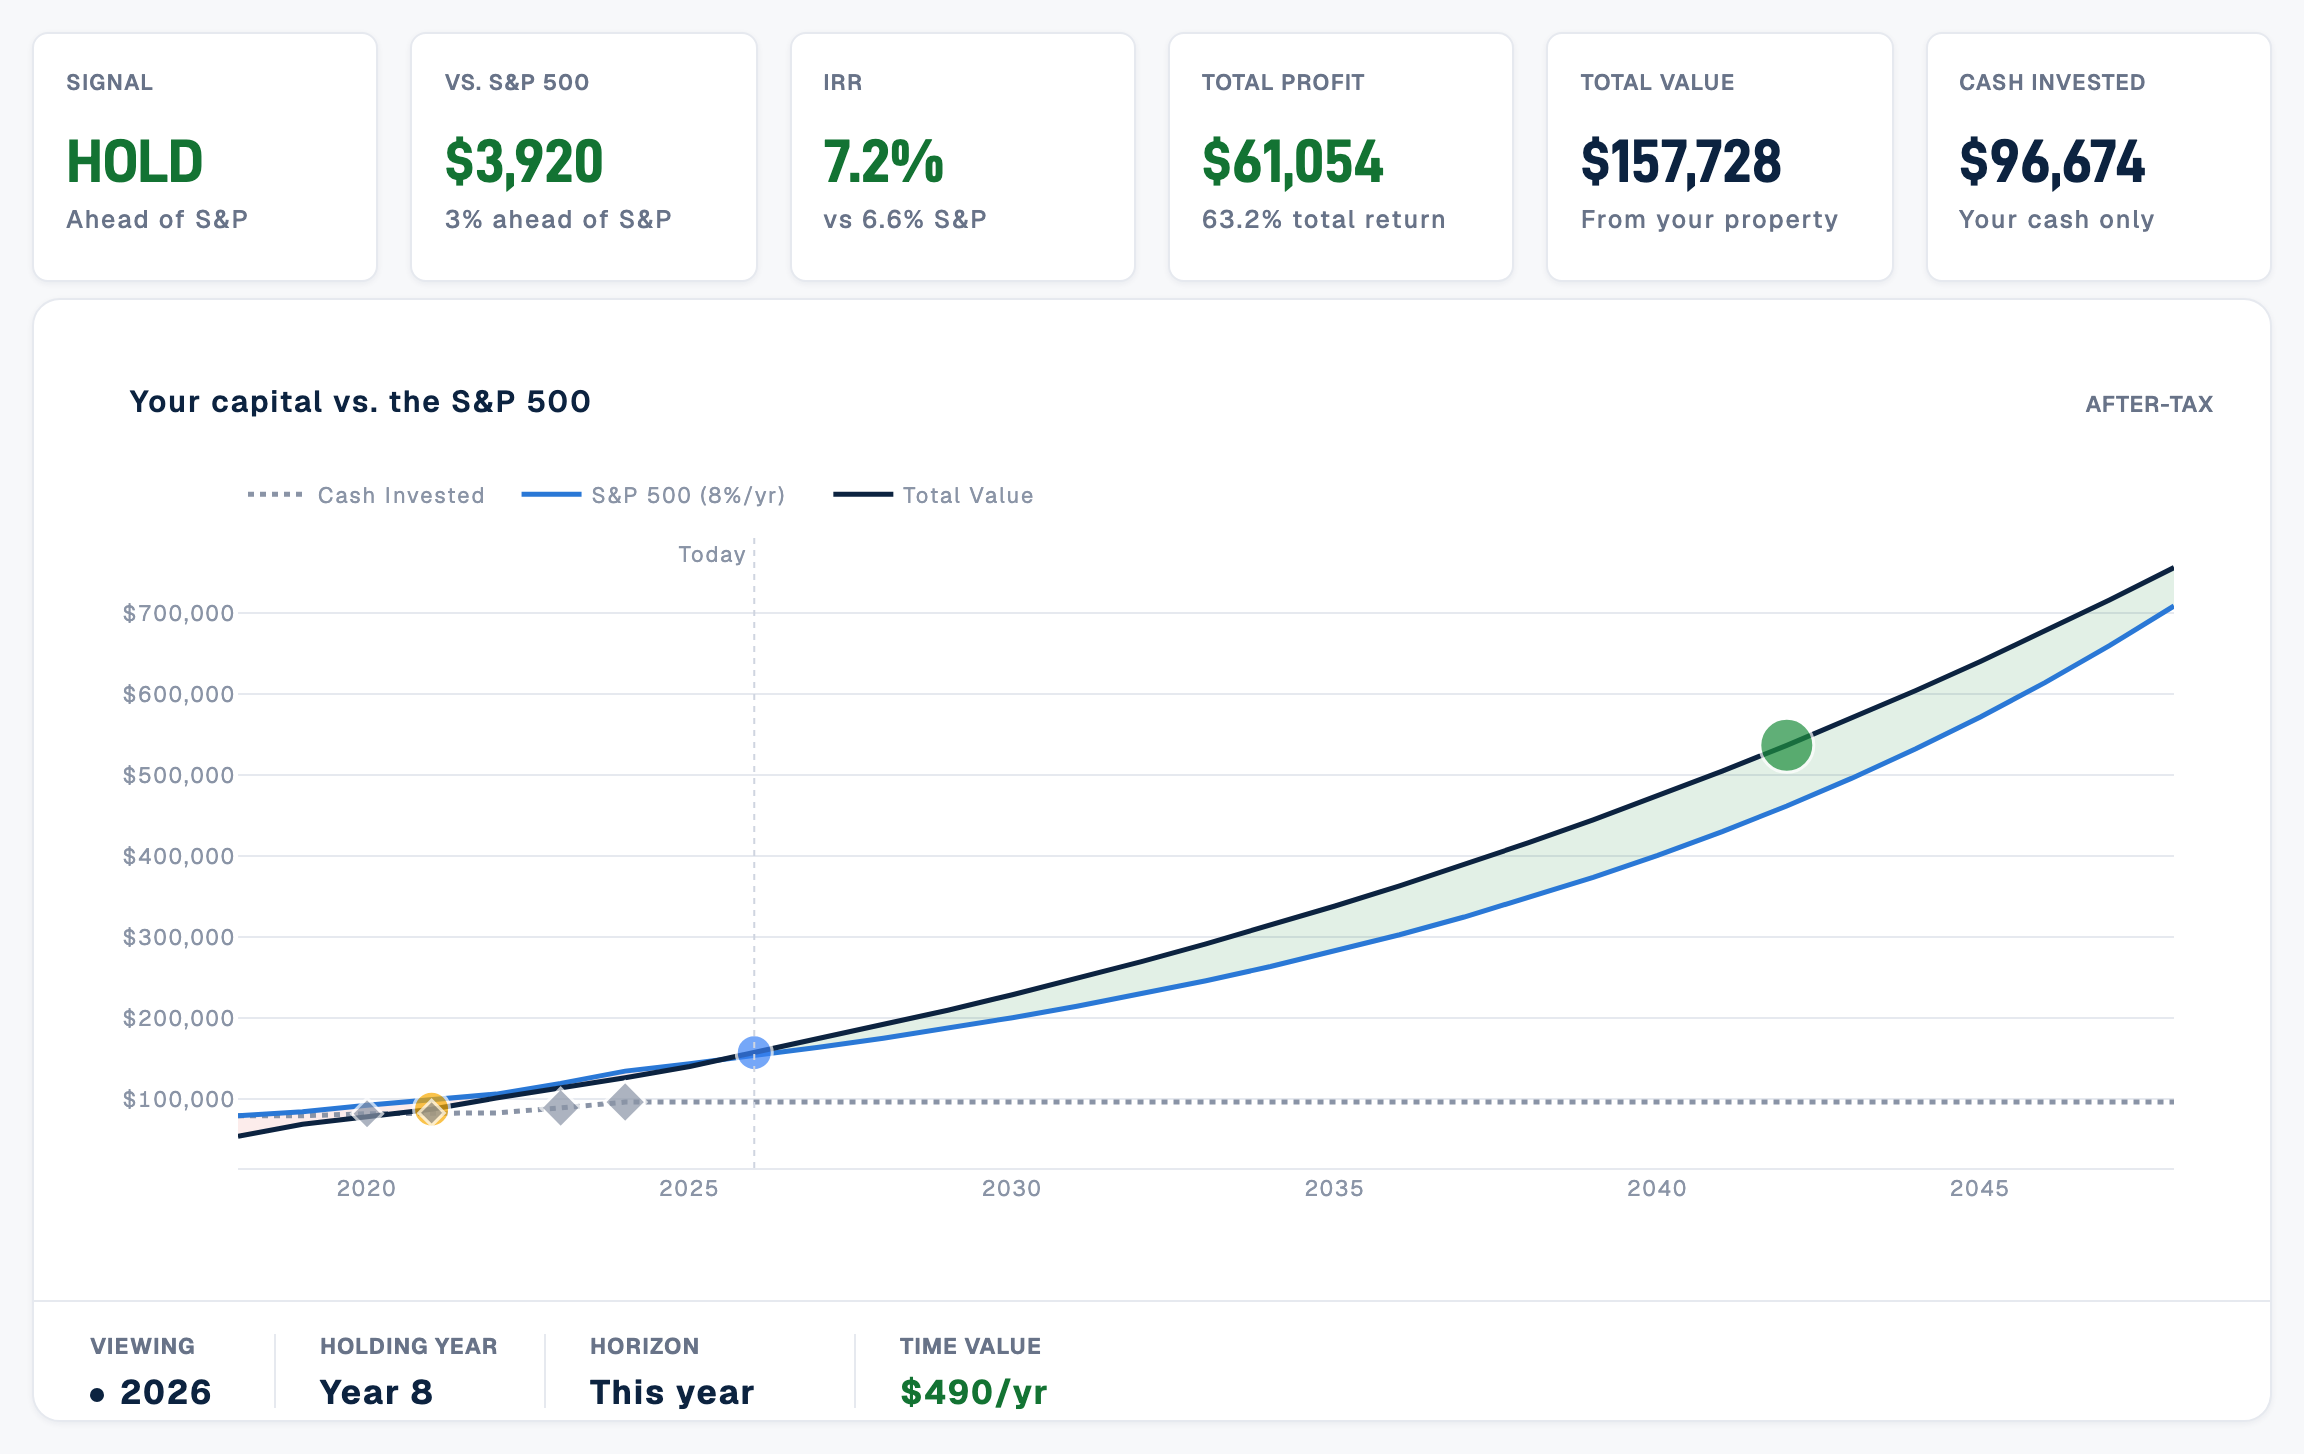
Step 3
Every dollar in and out, rolled into one return. Beside it, the same money in an index fund, using your own numbers.
Most tools stop at a number. Duplex Ray ends on a decision.
Your rental is ahead of the S&P 500, or it's worth waiting for. See how many years until it's worth the most.
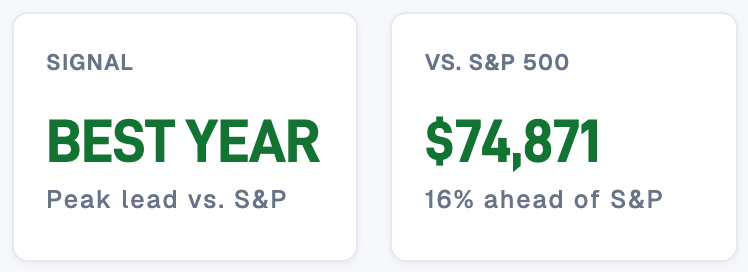
Your lead over the S&P 500 peaks now. It's the year to sell for the most, if selling is on your mind.
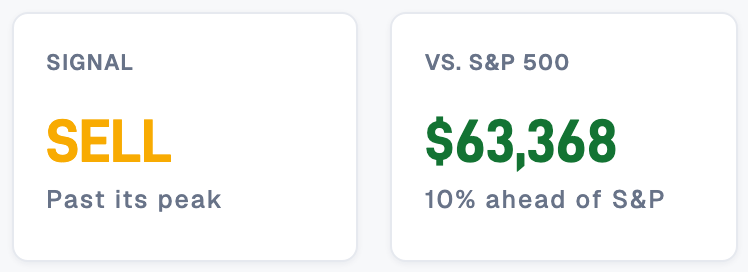
It's past its peak, or the index fund has pulled ahead. See your IRR next to the S&P's and what you'd walk away with today.
The verdict is math. The decision is yours. If you're tired of being a landlord, that counts too.
Demo
$0
Explore a sample duplex bought in 2018, with every lease, repair, and tax bill logged.
Open the demoResets when you leave, so click anything.
Free account
$0
Set up your own property.
Start freeNo email needed until you save.
Founding member Beta · locked for life
$99 $49/yr
Full access during beta, and $49 a year for as long as you stay.
You're on the list. $49/yr is held for you. We'll email you when payments open.
Email only. No card, no charge until payments open.
Meanwhile, set up your own property free.
Start with ours. You'll know in a few clicks whether you want to see yours.
Explore a live example